
A spinal cord stimulator trial succeeds in about 72% to 82% of appropriately selected patients, while therapy success at 12 months is closer to 61% to 65%. Those figures describe different stages of treatment, so they don't represent one universal spinal cord stimulator success rate for every patient.
A person researching spinal cord stimulation often wants one practical answer: will this reduce the pain enough to justify a permanent implant? The difficulty is that “success” can mean temporary pain relief during a trial, sustained relief after implantation, improved walking or sleep, reduced medication use, or satisfaction with the device.
The most useful way to interpret any reported rate is to ask three questions. What definition of success did the study use? How long were patients followed? Which outcome did researchers measure? Those details matter more than a headline percentage alone.
Table of Contents
- What the Spinal Cord Stimulator Success Rate Really Tells You
- How SCS Studies Define Success
- What the Evidence Shows at Each Time Point
- Reading Success Numbers by Outcome Measure
- Who Is Most Likely to Benefit Long Term
- Where SCS Results Fall Short
- Turning the Data Into the Right Questions for Your Care Team
What the Spinal Cord Stimulator Success Rate Really Tells You
A patient may hear that spinal cord stimulation has a high success rate and ask a reasonable question: “What are my chances?” The published figure cannot answer that by itself. It is a population average built from people with specific diagnoses, pain patterns, previous treatments, psychological factors, lead locations, programming methods, and follow-up periods.
For example, someone with neuropathic leg pain after surgery may have a different outlook from someone with another pain pattern, even when both are grouped under the same study category. A percentage is a starting point, not a personal forecast.
The evidence-based consensus guideline separates temporary trial results from outcomes after implantation. Its benchmarks are discussed in the timeline section below. It defines trial success as the share of patients who report benefit during the temporary trial, which makes that measure useful when clinicians assess whether permanent implantation is reasonable. The consensus guideline on SCS patient selection and trial stimulation also shows why trial and long-term results should not be treated as one outcome.
Three filters for every percentage
Definition comes first. One study may count success after a specified reduction in pain during the trial. Another may require relief at a later visit, while a third may include function, sleep, medication use, or satisfaction.
Time changes the answer. A temporary trial captures an early response. A later result reflects programming adjustments, adaptation, complications, changing pain conditions, and whether patients continue treatment.
The outcome measure changes the meaning. Pain intensity is only one measure. A patient may consider treatment successful because they sleep longer, walk farther, return to activities, or rely less on medication, even when pain remains.
A useful analogy is a map. The headline percentage shows the general route, while the diagnosis, treatment goal, time point, and measurement method show whether that route fits one patient.
Practical rule: A percentage without its time point and definition is not enough information to support an implant decision.
For general background, see spinal cord stimulation treatment information. The treating clinician must still relate population evidence to the patient's diagnosis, goals, and medical history.
How SCS Studies Define Success
SCS studies often define success in layers. Reading those layers helps explain why two credible studies can report different results without either study being misleading. The key question is not only whether treatment worked, but how researchers decided that it worked.
The temporary trial threshold
The first layer is the temporary trial. Leads are placed for a limited period, allowing the patient and care team to assess whether stimulation reduces the target pain during ordinary activities. A commonly used benchmark is at least 50% pain relief. The 2025 cohort of 505 SCS trial patients also defined trial success as at least 50% pain relief at lead removal.
This threshold works as a screening gate. It identifies patients who appear likely to benefit from implantation, rather than guaranteeing lasting relief. For example, someone may walk more comfortably during the trial but later need programming changes, lead revision, or another treatment plan. The trial answers an early question: does stimulation appear capable of helping this person's target pain?
Durable pain reduction
The second layer asks whether relief continues after implantation. Researchers may compare pain ratings before treatment with ratings at later follow-up visits, using a numeric rating scale or visual analog scale. The response threshold still shapes the result.
A study that counts only patients with a substantial reduction will report a different success rate from one that includes smaller, clinically meaningful improvement. The timing of follow-up also changes the interpretation. Early relief may later shift if pain coverage decreases, the underlying condition changes, or programming requires adjustment.
Composite outcomes
The third layer combines pain with measures such as physical function, sleep, daily activity, medication use, quality of life, and the patient's overall impression of change. These measures can show practical benefits that a pain score alone misses. A patient may describe treatment as successful because they can sleep longer, walk farther, return to routine activities, or reduce medication, even when some pain remains.
A “responder rate” therefore has a specific meaning. It shows how many participants crossed the threshold selected by the study. It does not necessarily show how much each participant improved, whether daily function changed, or whether the device remained useful over time. Look for the definition behind the percentage before using it to judge likely benefit.
What the Evidence Shows at Each Time Point
A patient may report strong relief during a temporary SCS trial, then face a different decision months after implantation. The timeline matters because each checkpoint measures a different stage of treatment: initial response, progression to implantation, or continued benefit in everyday care.
During the trial
The 2023 consensus evidence places the median trial success rate at 72% to 82% across randomized and observational studies. This figure describes selected patients who met the study's temporary-trial response criteria. It does not estimate how many will still benefit after implantation. The published consensus recommendations provide this benchmark and distinguish trial response from longer-term therapy success.
One randomized study reported an overall trial success rate of 88%, representing 87 of 99 patients. Its high-frequency group had a reported rate of 92%, or 46 of 50 patients, while the low-frequency group had a rate of 84%, or 41 of 49 patients. Results also varied by pain pattern. Predominant low back pain had a reported rate of 92%, or 59 of 64 patients, compared with 80%, or 28 of 35 patients, when leg pain was at least as prominent as low back pain. The randomized trial report shows why the patient mix and stimulation approach belong beside the headline percentage.
After implantation
The consensus benchmark for therapy success at 12 months is about 61% to 65%. This later checkpoint includes circumstances a short trial cannot capture, such as partial relief, changing pain, programming adjustments, follow-up loss, and decisions about continuing with an implant.
A 2025 real-world cohort followed the path from trial to permanent implantation. Among 505 trial patients, 86.1% met the study's trial-success definition, while 77.0% progressed to permanent implantation. The real-world cohort report illustrates why a positive trial and an implantation decision are separate outcomes. Preference, logistics, coverage, and other clinical considerations can affect the second step.
| Time point | Reported success range or result | Definition used | Representative evidence |
|---|---|---|---|
| Temporary trial | 72% to 82% median | Reported success during the temporary phase | 2023 consensus guideline |
| Temporary trial in one randomized study | 88% overall | Trial success, with results separated by stimulation type and pain pattern | 2019 randomized trial |
| Trial-to-implant pathway | 86.1% trial success; 77.0% permanent implantation | Study-defined response at lead removal, followed by progression to implantation | 2025 real-world cohort |
| Twelve-month therapy | About 61% to 65% | Therapy success at 12 months | 2023 consensus guideline |
Use the table as a timeline, not a promise. The percentage that matters depends on whether you are asking about temporary response, acceptance of implantation, or sustained benefit after living with the device.
Reading Success Numbers by Outcome Measure
Success depends on the outcome a study measures. A patient may report meaningful pain relief while showing little change in function, medication use, or overall satisfaction. Each measure captures a different dimension of treatment, so two studies can produce different success rates without assessing the same result.
| Outcome measure | Definition of success | Typical 12-month range | Clinical meaning |
|---|---|---|---|
| Pain relief | A study-defined reduction in pain intensity | Not standardized across the available evidence | Shows whether pain severity changed |
| Function | Improvement in daily activity, mobility, sleep, or condition-specific function | Not standardized across the available evidence | Shows whether relief translates into practical ability |
| Medication use | A reduction in reliance on pain medication | Not standardized across the available evidence | Indicates whether treatment changes the broader care plan |
| Patient impression | The patient's overall assessment of improvement | Not standardized across the available evidence | Captures whether the result feels worthwhile to the patient |
| Explant | Device removal over follow-up | Varies by follow-up period and study population | Shows when benefit, safety, hardware, or preference leads to removal |
Read the table as a set of different questions, not as a single forecast. The relevant percentage depends on whether you are asking about pain during a temporary trial, day-to-day function after implantation, or continued benefit after living with the device.
Pain scores are useful but incomplete
Pain reduction provides a clear endpoint, which makes it easier for researchers to compare participants. A pain score alone, however, cannot show whether someone can stand longer, sleep better, return to valued activities, or manage medication differently.
Function can improve even when a daily pain score changes only modestly. A patient might still experience significant pain yet regain the ability to walk through a store or sleep for longer periods. Before the trial, the care team should record specific goals such as walking distance, sleep duration, or a valued activity. Those details give the result a practical reference point instead of leaving judgment to one number.
Composite success is harder to achieve
Some studies require several results at once, such as pain relief plus functional improvement, satisfaction, or reduced medication use. This stricter definition usually produces a lower rate than a pain-only endpoint because every component must meet the study's threshold.
The 2023 consensus evidence emphasizes that reported success is threshold-dependent. Rates change according to whether researchers measure pain relief alone or combine pain, function, medication reduction, and satisfaction. Before comparing a quoted spinal cord stimulator success rate with another figure, ask which outcome measure was used, what threshold defined success, and whether the study measured one result or several together.
Who Is Most Likely to Benefit Long Term
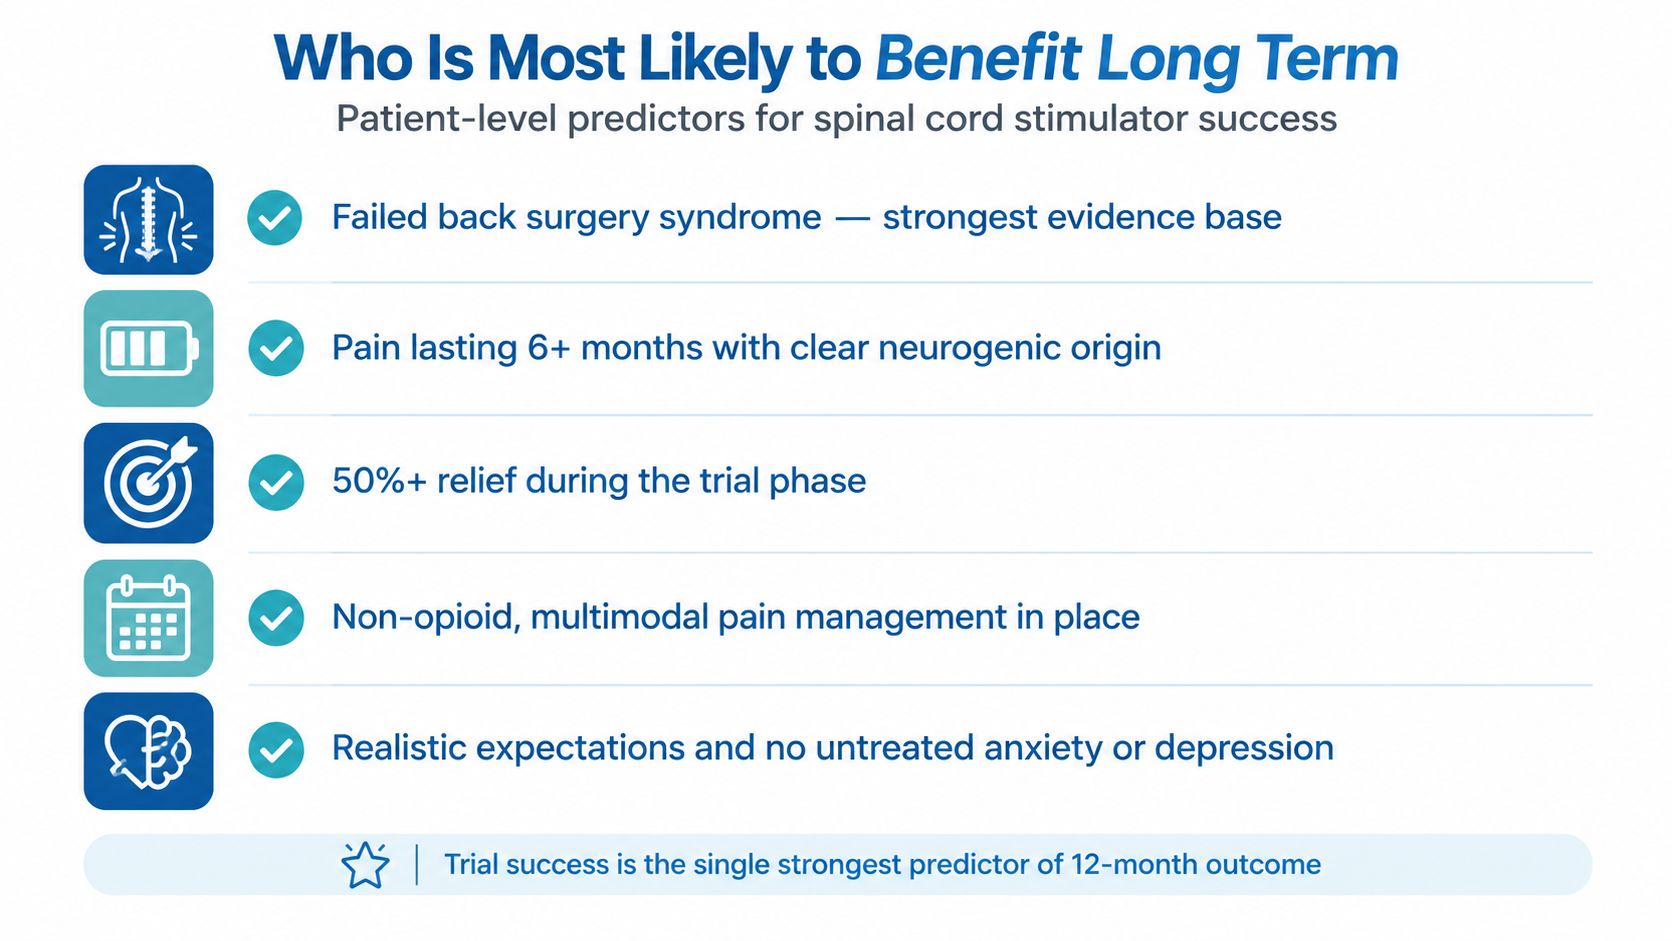
A patient may report strong relief during a temporary trial and still face a different decision about permanent therapy. Long-term benefit depends on the diagnosis, the pattern of pain, prior treatment, expectations, and the ability to manage follow-up care. These factors help clinicians judge fit, but no checklist can guarantee success.
A 2025 systematic review reported that up to 40% of patients don't obtain long-term pain relief. It found no objective method that accurately predicts success for neuropathic pain, and no patient-level or device-related factors that consistently explained differences in outcomes across studies. The systematic review of long-term SCS outcomes supports cautious, individualized counseling rather than a promise based on population averages.
A practical candidacy checklist
Pain diagnosis and phenotype: SCS is generally considered for selected chronic neuropathic pain, including persistent pain after spine surgery, complex regional pain syndrome, and refractory nerve-related limb pain. A clearly identified pain generator and a stimulation target that the system can plausibly reach make the discussion more specific. For suspected CRPS, complex regional pain syndrome evaluation and treatment information offers background, while diagnosis and candidacy still require an individualized clinical assessment.
Previous treatment: The care team reviews medications, rehabilitation, injections, surgery where appropriate, and other non-surgical options. The practical question is whether reasonable treatments have been assessed and whether the remaining pain continues to limit work, sleep, movement, or daily responsibilities enough to justify an implant pathway.
Psychological readiness: Reviews have associated pain catastrophizing, depression, anxiety, coping difficulties, nicotine use, and limited social support with poorer outcomes. Psychological assessment does not question whether pain is real. It identifies barriers that may need treatment and checks whether expectations, support, and device-management demands are realistic.
Trial response: A strong temporary-trial response gives useful evidence because the patient experiences the therapy before permanent implantation. Clinicians should examine the specific change, such as tolerating a shower, walking to a nearby shop, or sleeping through more of the night, rather than relying only on a general impression of relief. A trial response remains a signal, not a guarantee.
Long-term participation: SCS involves follow-up, programming, device use, and communication when coverage changes or new symptoms appear. Patients who can describe their goals, track meaningful changes, and report problems promptly give clinicians better information for adjustment. That ongoing partnership can affect whether the treatment remains useful.
Where SCS Results Fall Short
SCS studies provide useful evidence, but their success rates can appear more precise than the research supports. Studies may combine different diagnoses, stimulation methods, lead designs, follow-up periods, and definitions of success. One pooled average can therefore conceal meaningful differences among the patients, devices, and outcomes included.
A temporary trial and durable benefit answer different questions. The trial checks whether stimulation produces an early analgesic response. Long-term treatment also depends on lead position, programming, changes in the pain condition, altered pain processing, device tolerance, and whether the patient still considers the benefit worthwhile. A trial is like a short test drive, not a guarantee that the treatment will suit every future condition.
What long-term follow-up adds
A 2026 meta-analysis reported a pooled trial-phase failure rate of 16.2%. It found pooled explant rates rising from 4.0% at one year to 11.9% at three years, while rates of less than 50% pain reduction increased from 24.2% at one year to 32.8% at three years. The meta-analysis of trial failure, pain reduction, and explant outcomes shows why every success figure needs its follow-up window.
Explantation does not necessarily mean the original trial had no value. Benefit may fade, hardware problems may occur, another treatment may become preferable, or the device may no longer match the patient's goals. The reverse also matters: a device remaining implanted does not prove that substantial pain relief continues.
A positive trial is evidence of early responsiveness, not a lifetime warranty.
Newer technology alone does not determine the result. Waveform and device selection may matter, while patient factors, diagnosis, expectations, and long-term management also shape outcomes. A sound decision weighs the technology alongside alternatives and a clear plan for what happens if results fall short.
Turning the Data Into the Right Questions for Your Care Team
A consultation becomes more useful when a general percentage is turned into a written decision record. Before treatment, ask the care team to document the expected benefit, how it will be measured, and what happens if the temporary trial or permanent implant falls short. This keeps “success” tied to daily life rather than to a single number.
Define the trial before it starts
The team should identify which pain will be measured, which scale will be used, and what level of relief qualifies as a successful trial. Available cohort evidence commonly uses at least 50% pain relief as a benchmark. That threshold should be paired with practical goals, such as sleeping longer, walking farther, sitting through a meal, or tolerating work tasks.
Record questions such as:
- Diagnosis fit: Is the pain mainly neuropathic, and does the diagnosis have evidence supporting SCS?
- Trial measurement: How will pain, activity, sleep, and medication use be recorded during the temporary trial?
- Programming plan: Who adjusts the settings, and what is the next step if the first program misses the target pain?
- Implant decision: Which findings are required before proceeding to permanent implantation?
A useful example is a patient whose pain score improves but who still cannot stand long enough to prepare a meal. The team should decide in advance whether that result meets the patient's goals.
Match published outcomes to the individual
Ask which study population most closely resembles the diagnosis, pain pattern, prior procedures, and treatment goals. A study may report trial response, success at a follow-up point, pain reduction, functional change, medication use, satisfaction, or device removal. Those outcomes answer different questions and should not be treated as interchangeable.
Questions to bring include:
- Personal predictors: Do pain duration, previous surgery, psychological screening, nicotine use, social support, or medication history affect candidacy?
- Expected result: What degree of relief is realistic, and which activities should improve if treatment works?
- Center experience: What are the clinic's own trial, implantation, revision, and explant outcomes for patients with a similar diagnosis?
- Long-term care: How often are programming reviews needed, and how will changing symptoms be handled?
Plan for an imperfect result
Ask about lead migration, hardware problems, infection, revision procedures, explantation, imaging access, medication coordination, and coverage requirements. Also compare SCS with continued rehabilitation, medication management, injections, surgery when indicated, and other appropriate approaches through a broader pain management evaluation.
The central question is not only, “What is the spinal cord stimulator success rate?” Ask instead: “What would success look like for this patient, how will it be measured, and what is the plan if the benefit fades?” Clear answers help patients weigh a temporary trial against the longer commitment of implantation.
Interventional Pain Management evaluates chronic neuropathic and post-surgical pain, reviews prior treatments and imaging, and discusses spinal cord stimulation alongside appropriate non-surgical and interventional options. Patients in New Jersey and Staten Island can visit Interventional Pain Management to request an individualized consultation.